Hack 92. Document Your Database with Total Access Analyzer
Get the full nuts-and-bolts skinny on your database. Even a simple Access database has a lot in it. Just take a table of data, a form, a few controls, and a report, and the number of properties is in the hundreds. A large database has an unimaginable number of items in it. Now, imagine a utility that lets you drill down anywhere in your database and uncover nuggets of information you probably didn't even know about. Enter the Total Access Analyzer by FMS, Inc. (http://www.fmsinc.com). This outstanding product tells you everything about your database. It leaves nothing out. 9.2.1. Running the AnalyzerAfter you install the Analyzer, it is available as an add-in. Regardless of which database you have open, just go to the Tools Figure 9-1. Total Access Analyzer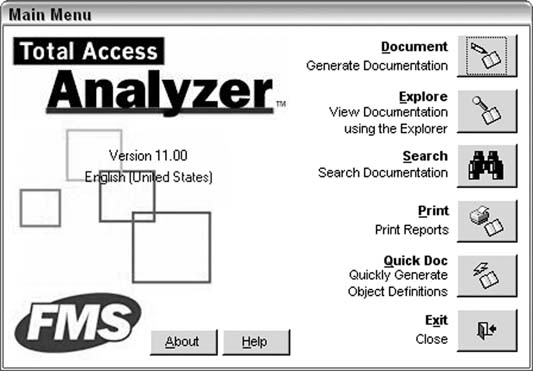
To get started, click the Document button. This runs the Documentation Wizard, which walks you through selecting which items to document. Figure 9-2 shows the first screen of the Documentation Wizard. After making a selection, click the Next button to bring up the wizard's second screen, shown in Figure 9-3. On this screen, you can select to document relationships, document security, and generate field cross references that show you where fields are used throughout the database, among other things. Generating field cross references is a great feature because although it's good to get details about a field, it's even better to know where the field's data is presented (on forms and reports). The documentation process works by writing the results to an external file. In the third wizard screen, shown in Figure 9-4, you can select where this external file goes (or just accept the default location) and then schedule the documentation. Figure 9-2. Documentation Wizard, step 1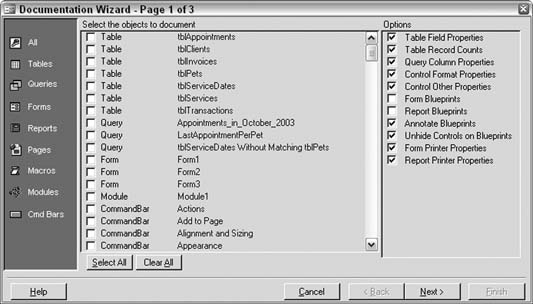
Figure 9-3. Documentation Wizard, step 2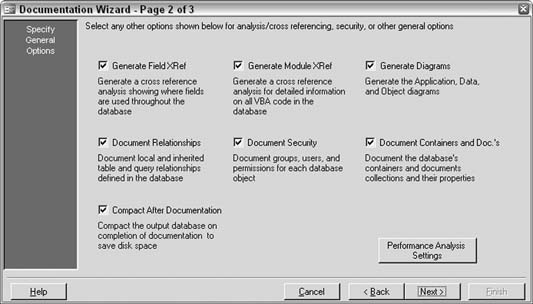
The documentation process begins when you click the Finish button. It can take a moment or two, depending on the size of the database. 9.2.2. Viewing the DocumentationTo view the documentation, click the Explore button back on the main form, shown in Figure 9-1. The Documentation Explorer opens, as shown in Figure 9-4. Documentation Wizard, step 3
Figure 9-5. In the Explorer, you select objects in the left explorer pane, and the details are shown in the right pane. Figure 9-5. Exploring the documentation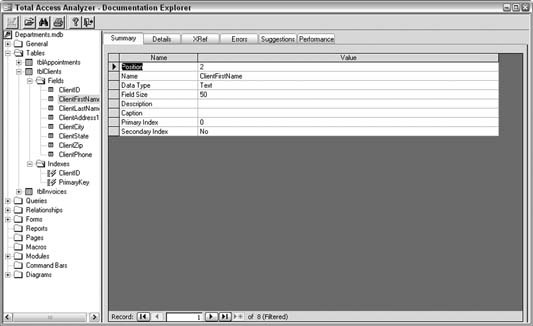
At this point you have a wealth of information to sift through. You can look up everything about your database and its objects; the Explorer's layout makes this easy. For example, as shown in Figure 9-6, you can see all the procedures in a module and their declarationsall next to each other and easy to compare. Just try doing that in a code module. 9.2.3. Errors and SuggestionsNot only does Total Access Analyzer document the database, but it also goes further to identify problems and offer suggestions. Figure 9-7 shows Figure 9-6. Exploring a module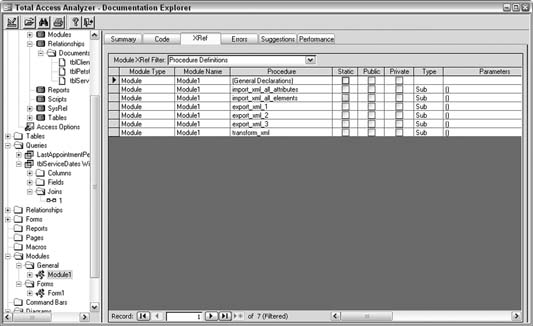
where a potential problem has been flagged. I tend to forget to set the Option Explicit setting in my modules. Well, I guess I can't get away with that anymore! Figure 9-7. Exploring an error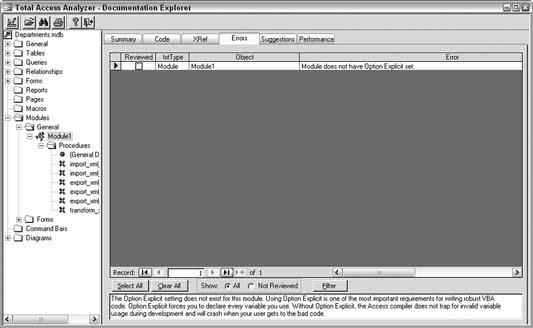
Figure 9-8 shows a list of suggestions the Analyzer has assembled. Such suggestions are really useful for making an application the best it can be. Figure 9-8. Exploring suggestions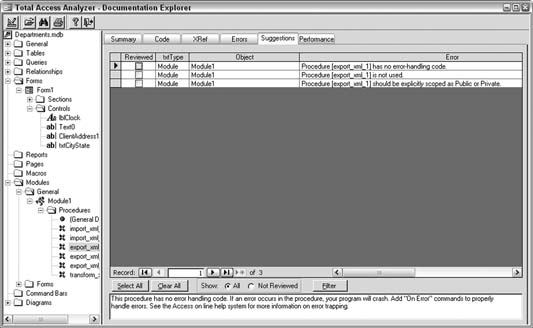
Total Access Analyzer is a great product not only for listing all the objects, properties, methods, and attributes about a database, but also for finding out what you can do to improve them. Other options from the main form include searching for particular items in the documentation and printing the documentation. |