


Debugging for web services such as ASP requires that the Enterprise Architect debugger is able to attach to a running service. Begin by ensuring that the directory containing the ASP .NET service project has been imported into Enterprise Architect and, if required, the web folder containing the client web pages. If your web project directory resides under the website hosting directory, then you can import from the root and include both ASP code and web pages at the same time.
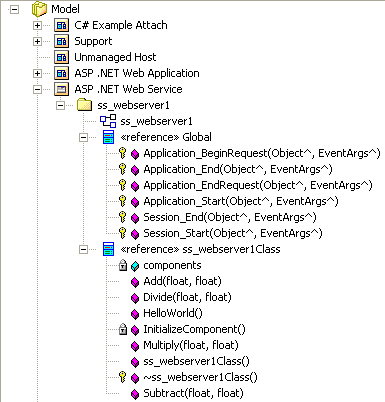
The following image shows the project tree of a web service imported into Enterprise Architect.
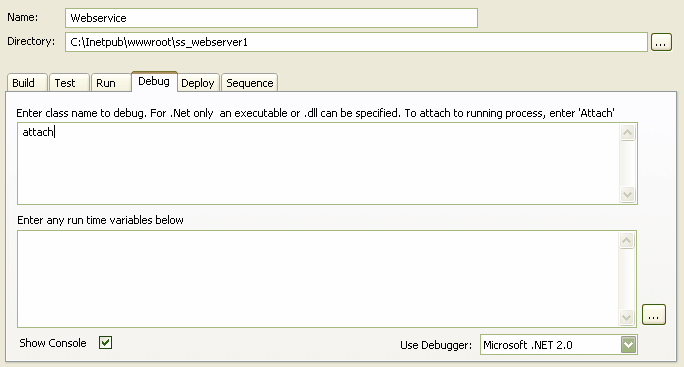
It is necessary to launch the client first, as the ASP .NET service process might not already be running. Load the client by using your browser. This ensures that the web server is running. The only difference to a debug script for ASP is that you specify the attach keyword in your script, as below.
When you start the debugger (click on the Debug Workbench Run button) the Attach To Process dialog displays.
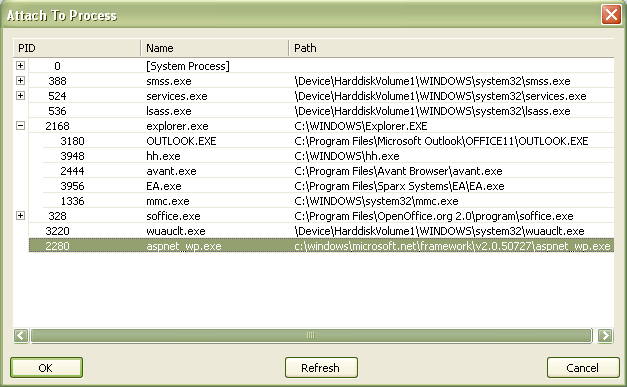
Note that the name of the process varies across Microsoft operating systems; check the ASP .NET SDK for more information. Select the aspnet_wp.exe process for the version configured (in the web.config file) for your web service, and click on the OK button.
The Debugger Toolbar Stop button should be enabled and any breakpoints should be red, indicating they have been bound.
Note: Some breakpoints might not have bound successfully, but if none at all are bound (indicated by being dark red with question marks) something has gone out of sync. Try rebuilding and re-importing source code.
You can set breakpoints at any time in the web server code. You can also set breakpoints in the ASP web page(s) if you imported them.