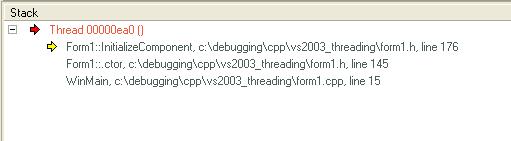
The stack view shows all currently running threads. Any thread that is at a breakpoint displays a stack trace. Clicking on the  (Run Debugger) button continues the thread until another breakpoint is encountered, or the thread ends.
| · | A yellow arrow is only present where a thread is suspended. It highlights the frame in the stack at which the thread's execution has suspended |
| · | A blue arrow indicates a thread that is running |
| · | A red arrow indicates a thread for which a stack trace history is being recorded |
| · | If multiple threads are suspended, you can click on the thread entry to select that thread |
| · | Selecting a thread results in that thread being displayed in orange; the Source Code Editor also changes to reflect the current line of code for that thread |
| · | Double-clicking a frame takes you to that line of code in the Source Code Editor; local variables are also refreshed for the selected frame. |
See Also


