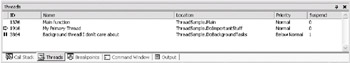
Everything is easier to understand when you can see a graphical representation. VS .NET provides a window for viewing information about all the running threads, but it's difficult to find. Many developers aren't even aware it exists at all. However, if you plan to do any multithreaded development, you'll need to have this window attached to your debugging toolbar almost all the time—it makes thread debugging ten times easier. While the program is in Debug mode (this option isn't available at other times), go to the Debug menu, select Windows, then select Threads, and you'll see the window shown in Figure 8-1.
The thread debugging window is the only way to answer basic questions like "Which thread is currently running?", "What functions are my threads currently in?", or even, "How many threads do I have?" All the fields on this window are useful, but notice in particular the name field. By default, threads are nameless, but you can change that by setting a meaningful name on each thread via its Name property. Names are your fastest way of identifying the purpose of each thread. Every time you create a new thread, immediately set the Name property to describe what the thread is doing: "Background polling thread", "Show splashscreen thread", etc. It'll greatly ease your debugging since it lets you instantly recognize which threads are relevant to your current task.
Another useful feature of this window is its ability to suspend and resume threads. Here's a common threading problem: You set breakpoints on your code, and you focus intensely as you step across the code on one thread's execution path… but then a different thread that you don't care about at the moment hits a breakpoint, and suddenly your focus is broken as the code window shifts to display that other code. If you haven't seen this yet, you will as soon as you start seriously debugging multithreaded code.
Sometimes, that problem is unavoidable because the program may require all threads run at once to compute a correct result. But some multithreaded programs still work with most threads disabled—for instance, rather than having a single thread analyze many independent records, you might create several "worker" threads, each of which runs identical code to analyze records in parallel. The program would still work with only a single thread; it would merely work slower. So in that situation, you could ease your stepping through the debugger by disabling most of the threads. Just go to the thread debugging window, right-click a thread and select Freeze. That thread won't interrupt you again until you thaw it.
| Caution |
Be careful to freeze threads only at an appropriate moment. Freezing a thread while it's holding a critical resource may force your other threads to wait for this frozen thread. If done deliberately, that can be an outstanding debugging aid. But if you're not expecting that behavior, it may lead you to believe your code has a bug where there is none. |
Many thread-related bugs can never be reproduced in a debugger. Thread problems occur only when the threads happen to switch at precisely the right time, and the debugger often slows execution to the point where the threads no longer switch in the same order. But don't give up on the debugger entirely. The same factors that make the debugger hide some thread bugs can make other thread bugs stand out. Besides, later in this chapter, we'll look at some ways of selectively freezing and thawing threads to track down threading problems. The VS .NET debugger wasn't really designed for multithreaded debugging, but it is better than nothing.